Introduction
Data visualization is a crucial aspect of data analysis, aiding in understanding patterns, trends, and distributions within datasets. Seaborn, a popular Python data visualization library, offers various tools for creating insightful visualizations effortlessly. However, encountering errors during visualization tasks is not uncommon. One such error, “kdeplot() takes from 0 to 1 positional arguments but 2 were given,” often puzzles users attempting to visualize data distributions using kernel density estimation (KDE) plots.
Understanding the Error for Kdeplot
The error message indicates that the kdeplot() function received more positional arguments than it expected. In the provided Python code snippet, kdeplot() expects either 0 or 1 positional arguments, but it received 2 positional arguments (x and y). This discrepancy triggers the TypeError, halting the execution of the code.
Root Cause Analysis
The root cause of this error lies in the incorrect usage of the kdeplot() function. When plotting KDE in Seaborn, the correct syntax involves passing the data directly to the function without explicitly mentioning x and y.
Solution
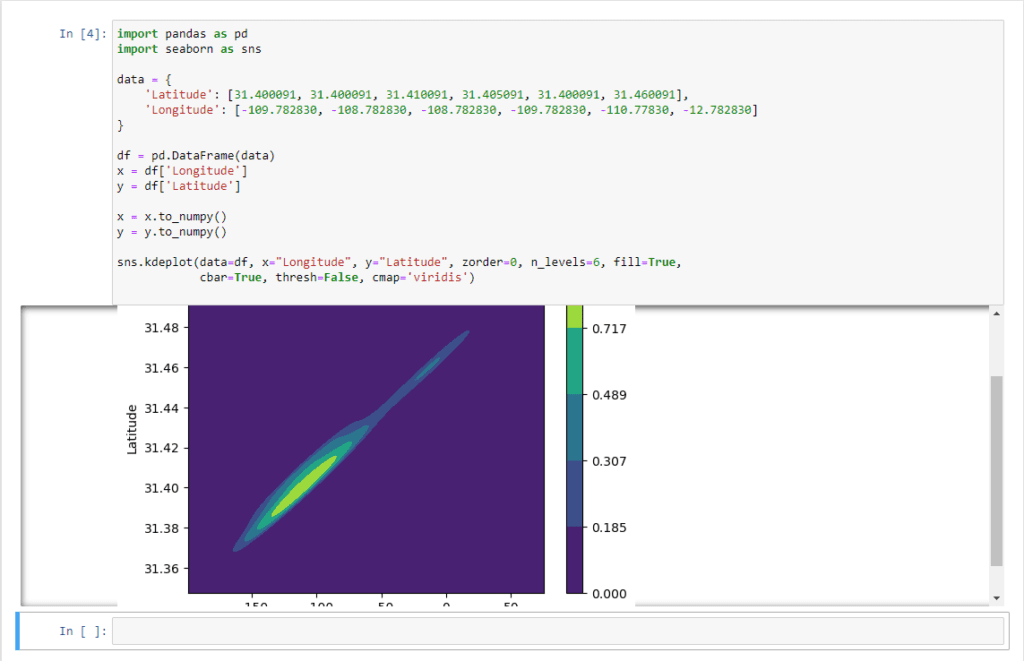
To rectify the error and successfully visualize the KDE plot, the code needs adjustment. Here’s the corrected version of the code snippet
import pandas as pd
import seaborn as sns

data = {
    'Latitude': [31.400091, 31.400091, 31.410091, 31.405091, 31.400091, 31.460091],
    'Longitude': [-109.782830, -108.782830, -108.782830, -109.782830, -110.77830, -12.782830]
}

df = pd.DataFrame(data)
x = df['Longitude']
y = df['Latitude']

x = x.to_numpy()
y = y.to_numpy()

sns.kdeplot(data=df, x="Longitude", y="Latitude", zorder=0, n_levels=6, fill=True,
            cbar=True, thresh=False, cmap='viridis')

Explanation
- The
dataparameter specifies the DataFrame containing the data to be visualized. xandyparameters denote the column names from the DataFrame representing the horizontal and vertical axes, respectively.- Other parameters such as
zorder,n_levels,shade,cbar,shade_lowest, andcmapconfigure various aspects of the KDE plot as per the user’s preferences.
TO READ MORE ABOUT scatterplot() takes from 0 to 1 positional arguments but 2 positional
By adhering to the correct usage of the kdeplot() function in Seaborn and ensuring proper parameter passing, the error “kdeplot() takes from 0 to 1 positional arguments but 2 were given” can be resolved. This allows data analysts and scientists to create informative KDE plots seamlessly, enhancing their understanding of data distributions and patterns.
Remember to always refer to the documentation and examples provided by Seaborn for accurate usage of its functions and to troubleshoot any encountered errors effectively.


