Introduction
Data visualization is an essential aspect of data analysis, allowing us to explore and communicate patterns and relationships within datasets effectively. Seaborn, a popular Python library built on top of Matplotlib, provides powerful tools for creating visually appealing statistical graphics. However, errors can occur during the visualization process, requiring troubleshooting and understanding. In this article, we will explore the TypeError that arises when using Seaborn’s scatterplot() function and provide a step-by-step analysis to resolve the issue. We will examine an erroneous code example and compare it with the correct implementation, highlighting the changes necessary to rectify the error.
Understanding the Error scatterplot()
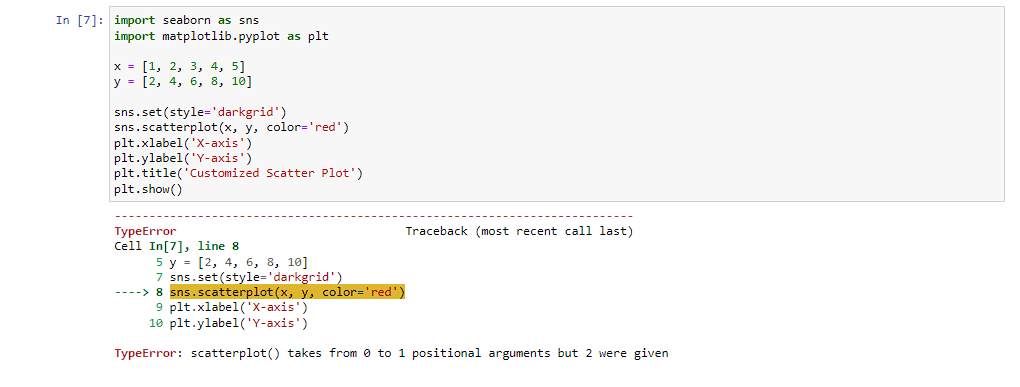
When executing the following code snippet
import seaborn as sns
import matplotlib.pyplot as plt
x = [1, 2, 3, 4, 5]
y = [2, 4, 6, 8, 10]
sns.set(style='darkgrid')
sns.scatterplot(x, y, color='red')
plt.xlabel('X-axis')
plt.ylabel('Y-axis')
plt.title('Customized Scatter Plot')
plt.show()

Resolving the Error
To fix the error, we need to make the following changes to the code:
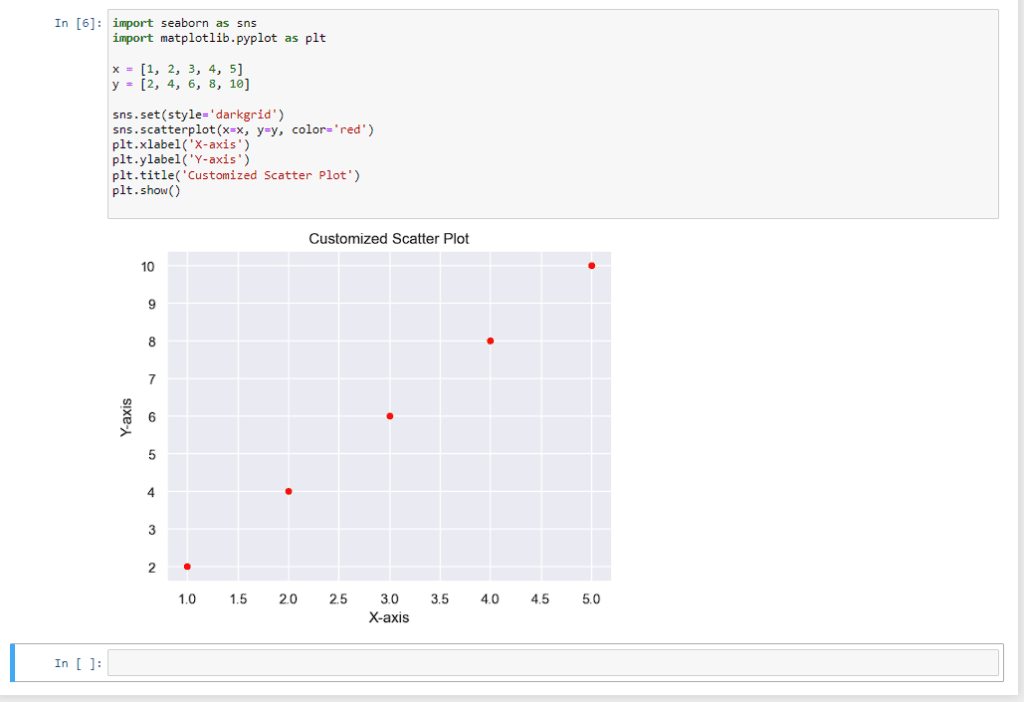
Specify the arguments by name: The erroneous code lacks explicit naming of the x and y arguments in the scatterplot() function. To resolve this, we should modify the code as follows
sns.scatterplot(x=x, y=y, color='red')
By specifying the arguments by name, we ensure that they are correctly assigned within the function call.
Corrected Code
Here’s the corrected code
import seaborn as sns
import matplotlib.pyplot as plt

x = [1, 2, 3, 4, 5]
y = [2, 4, 6, 8, 10]

sns.set(style='darkgrid')
sns.scatterplot(x=x, y=y, color='red')
plt.xlabel('X-axis')
plt.ylabel('Y-axis')
plt.title('Customized Scatter Plot')
plt.show()
Conclusion
The TypeError encountered when executing the code sns.scatterplot(x, y, color='red') in Seaborn’s scatterplot() function is due to the incorrect usage of positional arguments. By explicitly naming the x and y arguments within the function call and ensuring the necessary libraries are imported, the error can be resolved. Understanding and addressing errors during data visualization are crucial skills, allowing us to create accurate and informative visual representations of our data.

What is Seaborn?
Seaborn is a Python library built on top of Matplotlib that provides powerful tools for creating visually appealing statistical graphics. It is commonly used for data visualization in data analysis and data science projects.
What is a scatter plot?
A scatter plot is a type of data visualization that displays the relationship between two variables by plotting points on a two-dimensional plane. Each point represents an observation in the dataset, with one variable plotted on the x-axis and the other variable plotted on the y-axis.
What is a TypeError in Python?
A TypeError is a common error in Python that occurs when an operation or function is applied to an object of inappropriate type. It typically indicates a mismatch between the expected and actual types of the arguments passed to a function or method.
What causes the TypeError in Seaborn’s scatterplot() function?
The TypeError in Seaborn’s scatterplot() function occurs when the function is called with positional arguments instead of named arguments. This means that the x and y variables are not explicitly specified within the function call, leading to a mismatch in the expected arguments.
How can I resolve the TypeError in Seaborn’s scatterplot() function?
To resolve the TypeError, you need to specify the x and y variables as named arguments within the scatterplot() function call. This ensures that the variables are correctly assigned to the corresponding arguments within the function.
What changes need to be made to the code to fix the error?
To fix the error, you need to modify the code to explicitly name the x and y variables within the scatterplot() function call. For example, you can write sns.scatterplot(x=x, y=y, color='red') instead of sns.scatterplot(x, y, color='red').


